You hand over a chunk of your paycheck each year in taxes. Ever wonder exactly where that money goes? Does it fix potholes in your neighborhood or pay soldiers overseas? Governments at federal, state, and local levels collect these funds to run services we all rely on, from schools to national security.
In 2026, the federal budget hits $7.4 trillion in spending, but revenue covers only about $5.5 trillion, leaving a $1.9 trillion deficit. Income taxes make up roughly 50% of that revenue, while payroll taxes add 34%. The rest comes from corporate taxes and smaller sources. States and locals pull in money from sales taxes, property taxes, and federal grants too.
This breakdown shows government tax spending in action. You’ll see federal priorities first, then state and local uses, how funds flow, and what’s ahead. Understanding this helps you see the real impact on your life.
Breaking Down Federal Spending: The Biggest Chunks of Your Taxes
Congress shapes the federal budget through yearly bills. Mandatory programs like Social Security grow automatically. Discretionary items, such as defense, need fresh approval each time. In fiscal year 2026, these choices drive big shifts.
Social Security and Medicare lead the pack because more Americans retire each year. Defense gets a boost amid global tensions. Debt interest climbs fast as borrowing piles up. Federal grants send cash to states for health and roads.
Here’s a quick look at top categories based on 2026 projections:
| Category | Amount (approx.) | Share of Budget | Key Notes |
|---|---|---|---|
| Social Security | $1.5 trillion | ~20% | Retirement benefits for 67 million people |
| National Defense | $1.01 trillion | 14% | +13% increase, includes border security |
| Medicare | $900 billion | ~12% | Health coverage for seniors |
| Interest on Debt | $700 billion | ~9% | Fastest-growing expense |
| Grants to States | $800 billion | ~11% | Funds Medicaid, education, welfare |
This table captures over 65% of total spending. Numbers come from recent Congressional Budget Office updates. For more visuals, see the PGPF Chart Pack on the US budget.
Social Security and Medicare: Safety Nets for Seniors
These programs eat the biggest slices. Social Security sends monthly checks to retirees, disabled workers, and survivors. It supports about 67 million folks. Costs hit $1.5 trillion in 2026 because baby boomers keep retiring.
Medicare covers doctor visits and hospital stays for those 65 and older. Spending nears $900 billion. Both grow on autopilot due to an aging population. Fewer workers pay in as more draw benefits.

Think of your grandparents. Their checks buy groceries and cover bills. Medicare pays for hip replacements. Without these, many seniors would struggle. However, trust funds face shortfalls by 2034 unless Congress acts.
National Defense: From Troops to Tech
Defense claims $1.01 trillion, up 13% from last year. This funds troops, ships, jets, and cyber tools. Veterans’ care adds billions more. Border security gets a $175 billion push for walls and agents.
Why the rise? Tensions with China and Russia demand readiness. New tech like drones eats funds too. Meanwhile, non-defense areas face cuts. Justice grants drop 15%, hitting police hiring.
Soldiers train daily because of this budget. Factories build tanks. It keeps the country safe, but some question if every dollar counts.
Paying the Bills: Interest on National Debt
Interest payments top $700 billion now. That’s cash just to service past borrowing. Debt hits 120% of GDP by 2036. Rates stay high, so costs soar.
Picture a credit card balance growing. You pay more on interest than new buys. This crowds out schools or roads. In short, it limits choices. Check USAFacts federal budget overview for trends.
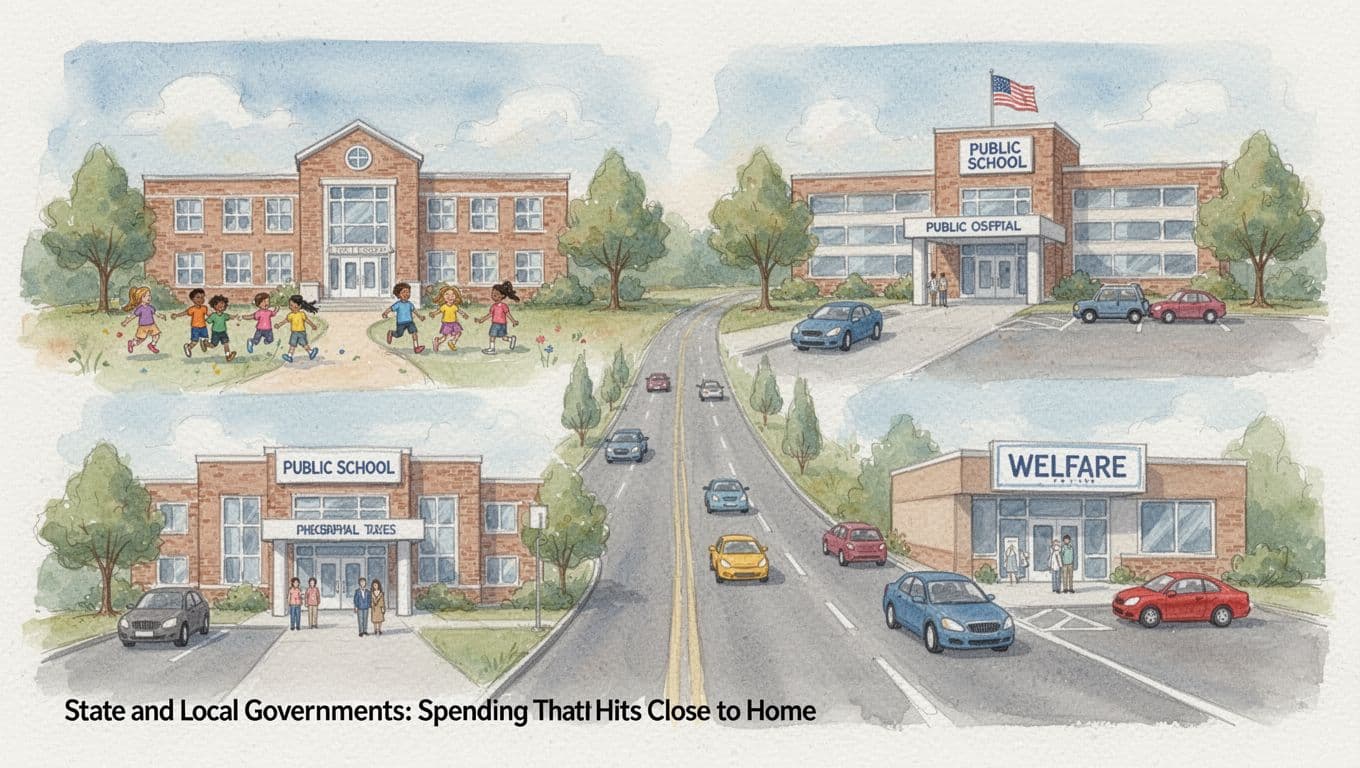
State and Local Governments: Spending That Hits Close to Home
States and cities spend about $3.5 trillion yearly. Federal grants cover 30% of their revenue. Own taxes like sales (35%), property (30%), and income (25%) fill the rest.
Top uses match local needs. Education takes the largest share. Health programs like Medicaid follow. Roads, bridges, and welfare round out priorities. Costs rise as populations age and schools demand more.
Your property taxes fund the fire truck nearby. Sales taxes pave highways. Federal aid boosts these efforts, especially after recent infrastructure laws.
California pours billions into universities. Texas fixes highways with gas taxes. Trends show health eating more as Medicaid expands.
Education and Schools: Building the Future
K-12 schools claim nearly half of state budgets in some places. Funds buy books, buses, and teacher pay. Federal grants via the Labor-HHS-Education bill add help.
Colleges get state support too. Your kid’s classroom runs on these dollars. Test scores improve when funds flow right. However, teacher shortages persist despite spending.
Health Care and Welfare: Helping Those in Need
Medicaid covers low-income families. States match federal dollars. Food stamps and housing aid prevent hardship. These programs serve millions.
A single mom gets checkups because of this. Costs climb with enrollment. See KFF data on state spending distribution for details by state.
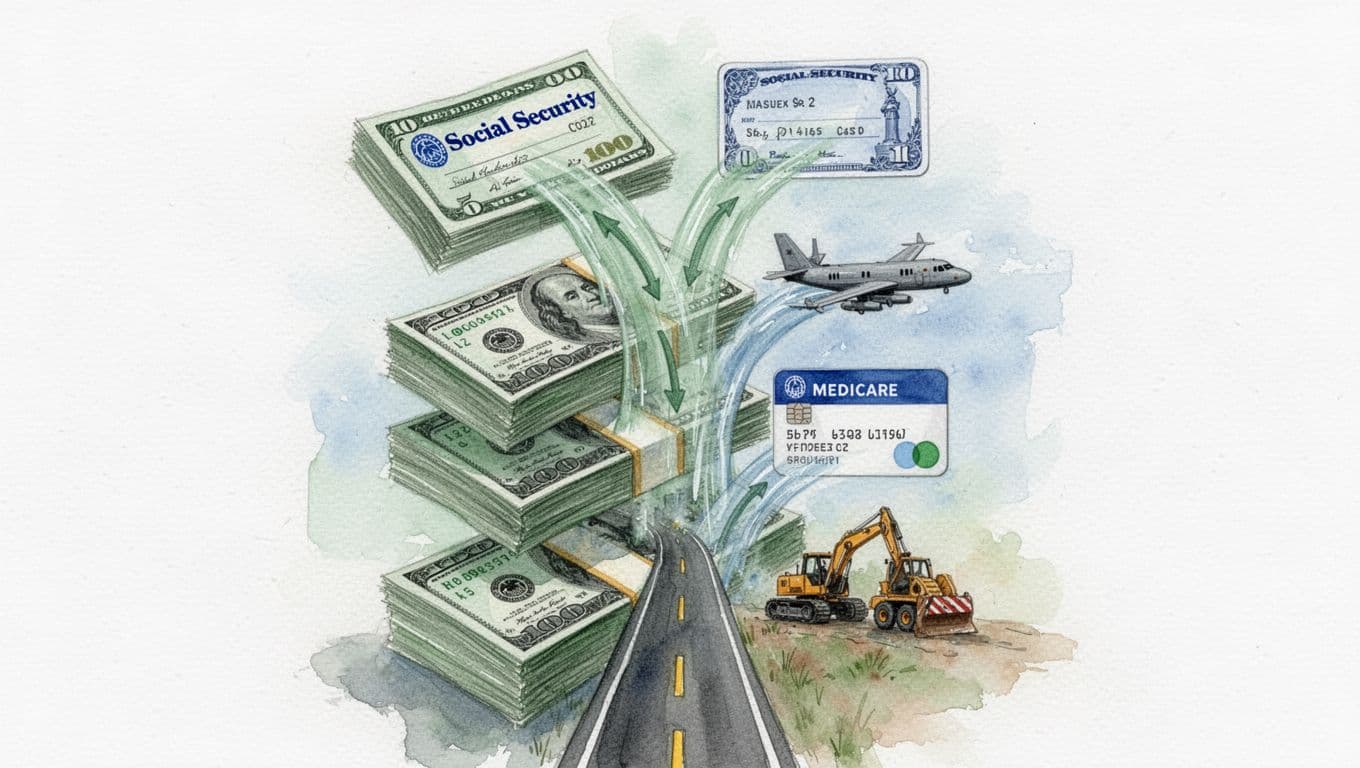
The Full Picture: How Taxes Turn into Public Services
Taxes flow from your paycheck to the IRS. Treasury collects them. Congress allocates via 12 bills. Delays lead to shutdowns, like in late 2025.
Income taxes (50%) and payroll (34%) dominate. Funds hit agencies. Social Security goes direct to beneficiaries. Defense pays contractors.
Oversight comes from audits and sites like USAspending.gov. Voters track reps’ votes. Transparency builds trust.
This process turns paychecks into parks and protection. Delays hurt, but it works most years.
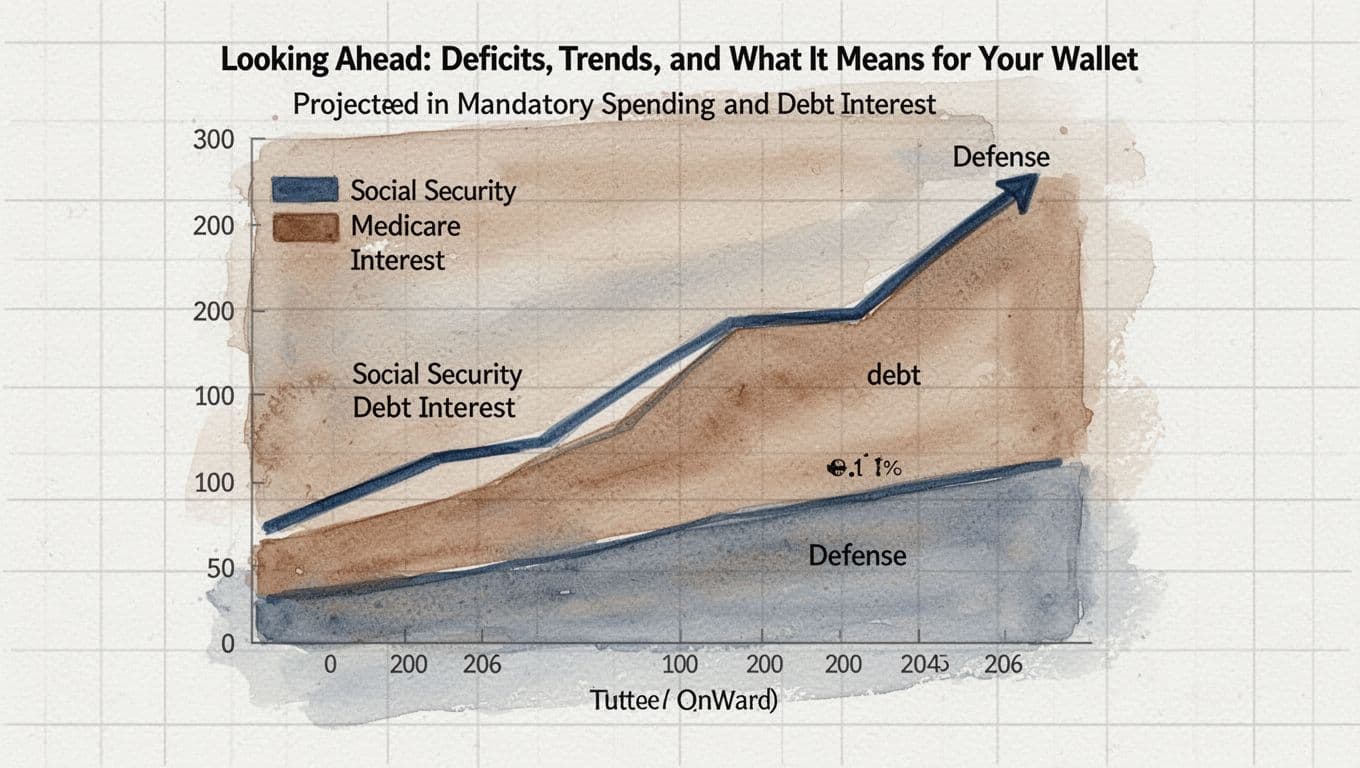
Looking Ahead: Deficits, Trends, and What It Means for Your Wallet
Mandatory spending like Social Security swells. Interest races up. Defense holds steady with gains. Non-defense cuts hit justice and health.
The $1.9 trillion deficit equals 5.8% of GDP. It grows to $3.1 trillion by 2036. Higher debt means future tax hikes or program trims.
Infrastructure gets boosts for roads. Vote and call reps to shape this. Trends favor retirees over youth programs.
Federal focuses on security and seniors. States handle schools and health. Knowledge arms you at the polls.
Check USAspending.gov for real-time data. Contact your lawmakers. What change will you push for next? Democracy thrives when you engage.